
Best Server Monitoring Tools for 2026
A server can stay online while a backup fails, a queue stops, or a nightly report never runs. That is why useful server monitoring covers the work a server should complete, not only whether its ports respond. Here are six options for monitoring scheduled work, with Watchgoose first for teams that want focused checks without a resident monitoring agent.
Scope note: This comparison focuses on scheduled work running on servers: cron jobs, backups, queues, scripts, and similar recurring tasks. It does not compare full host-metrics platforms for CPU, memory, disk I/O, process graphs, or distributed traces. Pair a scheduled-work monitor with an infrastructure monitor when you need both views.
This guide is published by Watchgoose. We rank Watchgoose first for the focused, no-resident-agent use case described here. The tradeoffs below are explicit, and the images are original Watchgoose editorial diagrams rather than vendor-interface screenshots or endorsements.
Table of contents
- Watchgoose: Focused monitoring without a resident agent
- Cronitor: Rich run history for jobs and queues
- Dead Man's Snitch: Simple coverage for one critical task
- UptimeRobot: Scheduled checks beside uptime monitoring
- Better Stack: Heartbeats inside a broader incident workflow
- Healthchecks.io: A simple heartbeat model with a self-hosted option
- Comparison table
- How to choose
- Frequently asked questions
- Conclusion
1. Watchgoose: Focused monitoring without a resident agent
Watchgoose is a hosted monitor for cron jobs, backups, queues, scripts, and other recurring work. Your task sends a success signal after it finishes. If the expected signal does not arrive within its schedule and grace period, Watchgoose alerts you.
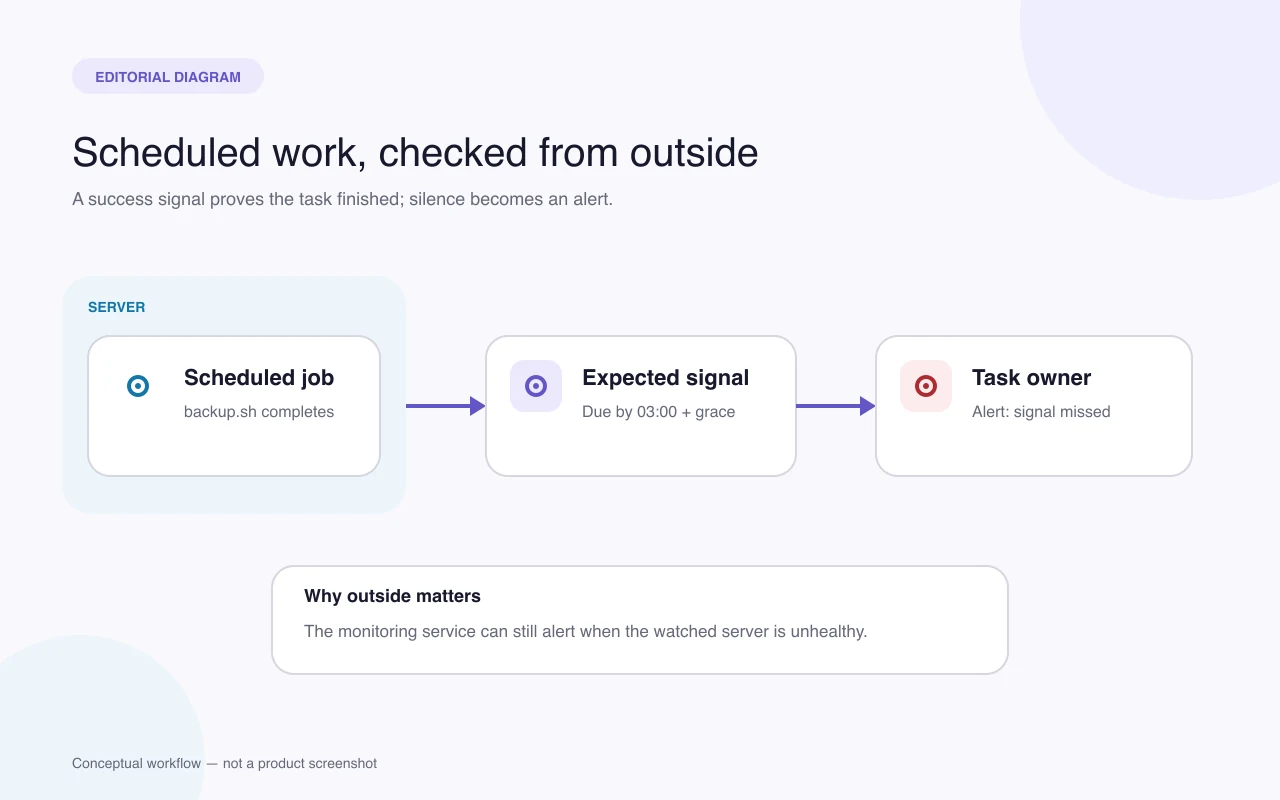
That model catches a gap that ordinary uptime checks miss. A web server can return HTTP 200 while its nightly backup produces no file or its invoice sync never starts. Monitoring the expected outcome keeps the check close to the actual failure mode.
There is no Watchgoose service to install and patch on every host. A job can send its signal with curl, a small HTTP client, or an existing integration. This is useful for small teams, freelancers, and Open Source maintainers who want an external check without adopting another host-management layer.
The same pattern works across several task types:
- Cron jobs and systemd timers: signal only after the command succeeds.
- Backups: verify the expected artifact before sending success.
- Queues and batch workers: signal after the batch reaches its intended state.
- Scripts and scheduled workflows: report success or an explicit failure from the final step.
Watchgoose supports multiple notification channels, so an alert can reach the place where the responsible person already works. Start with one task you would most regret missing, then deliberately test the alert path before adding the rest.
Watchgoose is also AI-ready. Its hosted Model Context Protocol (MCP) server gives Claude and Codex access to approved, project-scoped tools, with read-only access selected by default. Watchgoose is available in Claude's connector directory and ChatGPT's plugins directory for GPT and Codex, and its server is listed in the official MCP Registry.
The tradeoff is scope. Watchgoose does not collect deep host metrics such as memory pressure, disk latency, or process-level CPU. Pair it with a host or infrastructure monitor when those signals matter. For scheduled work, the narrower model means less software on the host and a direct answer to one question: did the task report the expected result?
The cron job monitoring documentation explains how to place the success signal. The reliability guide covers failure signals, output checks, and avoiding a false success ping at the start of a task.
2. Cronitor: Rich run history for jobs and queues
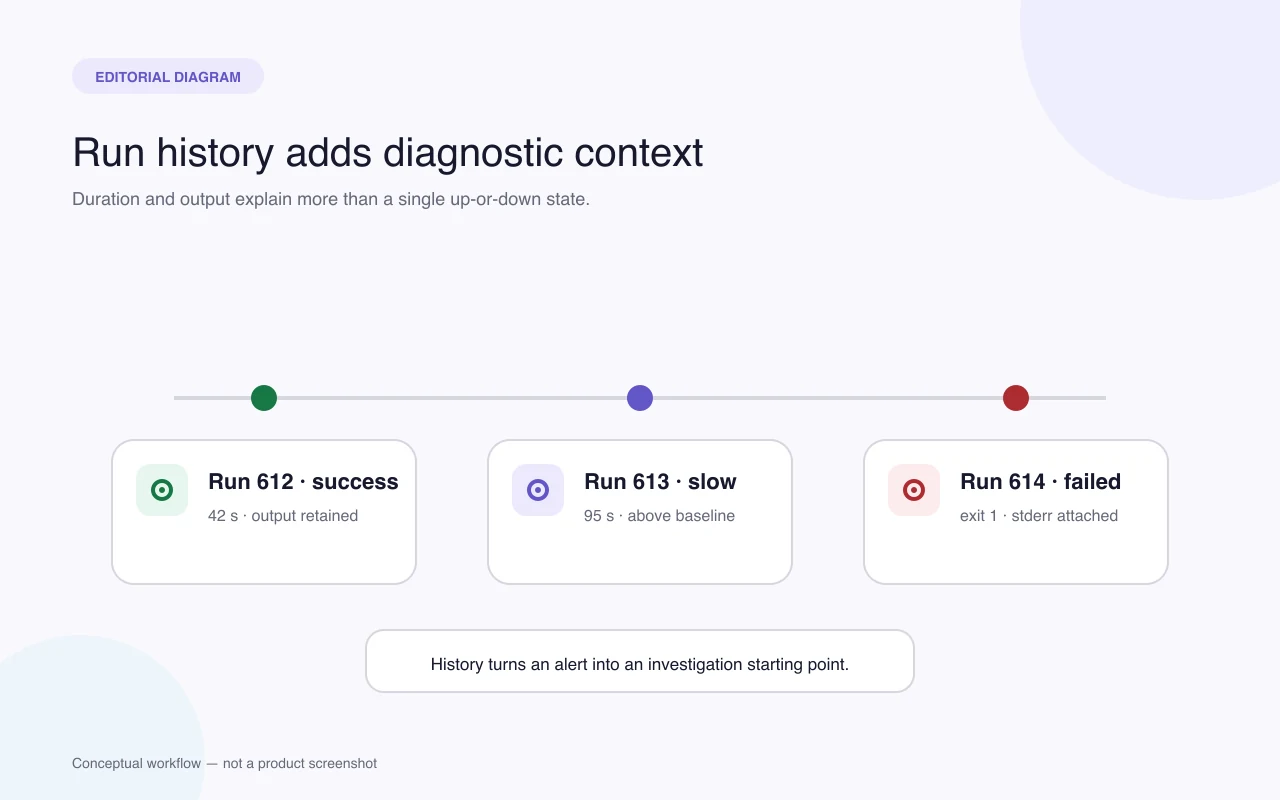
Cronitor fits teams that need more execution detail than a missing-heartbeat alert. It can distinguish a failed run from one that starts late, never starts, or runs unusually long.
Cronitor's CLI can read a crontab or Windows Task Scheduler configuration, create monitors, and wrap selected commands. It also supports HTTP events, SDKs, and other integrations. That range helps when scheduled work spans several systems rather than one shell script.
The service can capture standard output and standard error against the execution that produced them. It also records duration, success rate, and custom metrics. Those details help distinguish a dead backup from one that still finishes but takes longer every night.
Grace periods, schedule tolerance, and failure tolerance can reduce noisy alerts. For example, a team can wait for repeated misses before escalating an occasionally unreliable low-risk task. That flexibility is useful, but every tolerance also delays a real alert, so test it against the consequence of the job being late.
Cronitor's no-cost Hacker tier currently includes five monitors with email and Slack alerts. Its paid plans add more alert integrations and retention. Verify current limits before moving production checks because allowances and channel availability can change.
Choose Cronitor when output, duration, and per-run history are part of diagnosis. If all you need is proof that a nightly job completed, Watchgoose offers a more focused operating model.
3. Dead Man's Snitch: Simple coverage for one critical task
Dead Man's Snitch is a deliberately simple heartbeat monitor. You create a “snitch,” add its URL to the end of a recurring task, and receive an alert when the expected check-in does not arrive.
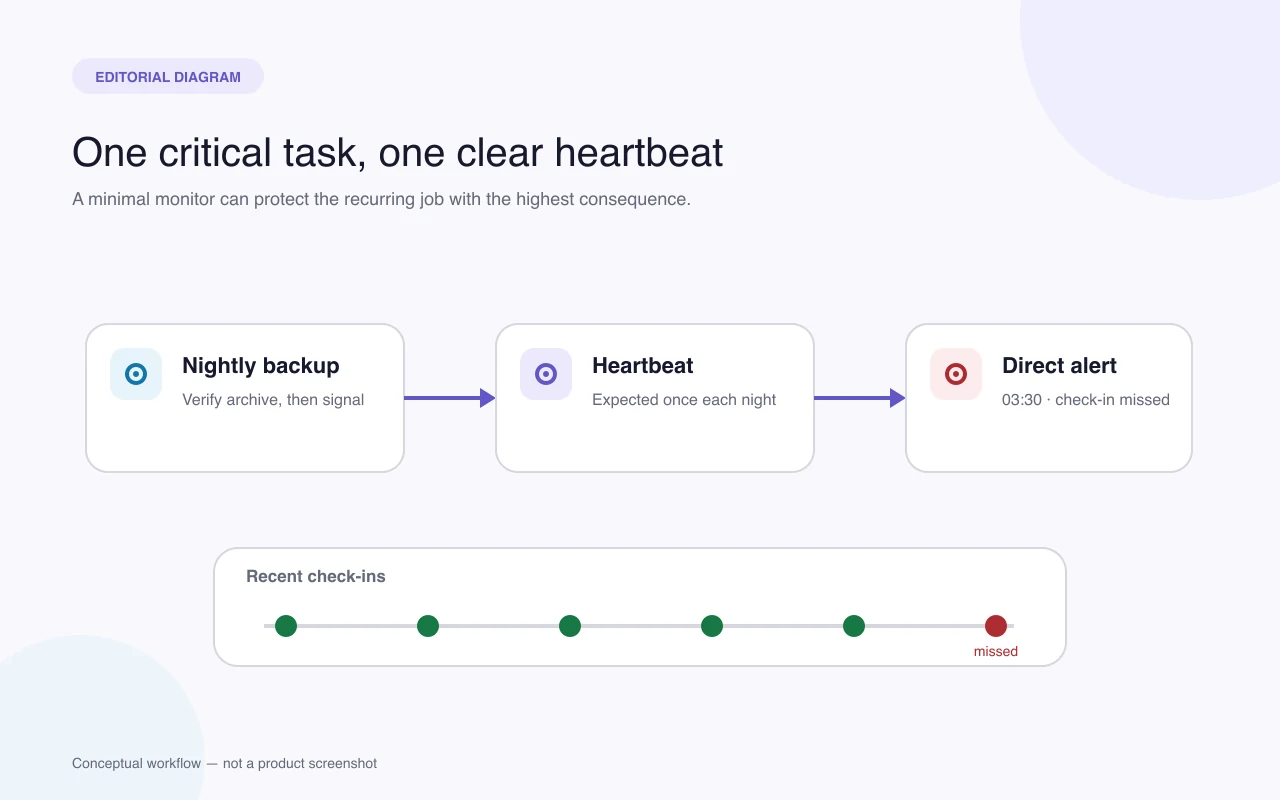
The model suits a nightly backup, data import, or report that must finish before the workday starts. The operator does not need to review a broad dashboard; they need a clear answer about one expected run.
Its no-cost Lone Snitch plan currently covers one snitch. That can be enough for a personal project or one high-risk task. The paid plans add more snitches and capabilities, so count every backup, sync, cleanup job, and scheduled deployment before deciding that the smallest plan will remain enough.
Put the check-in at the end of the useful work. A task that signals first and fails halfway through has produced a false success. Allow enough grace for normal run-time variation as well: an unrealistically tight window turns slow but healthy work into noise.
Use Dead Man's Snitch when the decision rule is intentionally small: one task, one expected check-in, and one alert path. Use a broader scheduled-work monitor when the list or the response workflow grows.
4. UptimeRobot: Scheduled checks beside uptime monitoring
UptimeRobot is a practical option for teams that already keep website and endpoint checks in its dashboard. Its heartbeat monitoring expects requests from recurring jobs and alerts when they stop arriving.
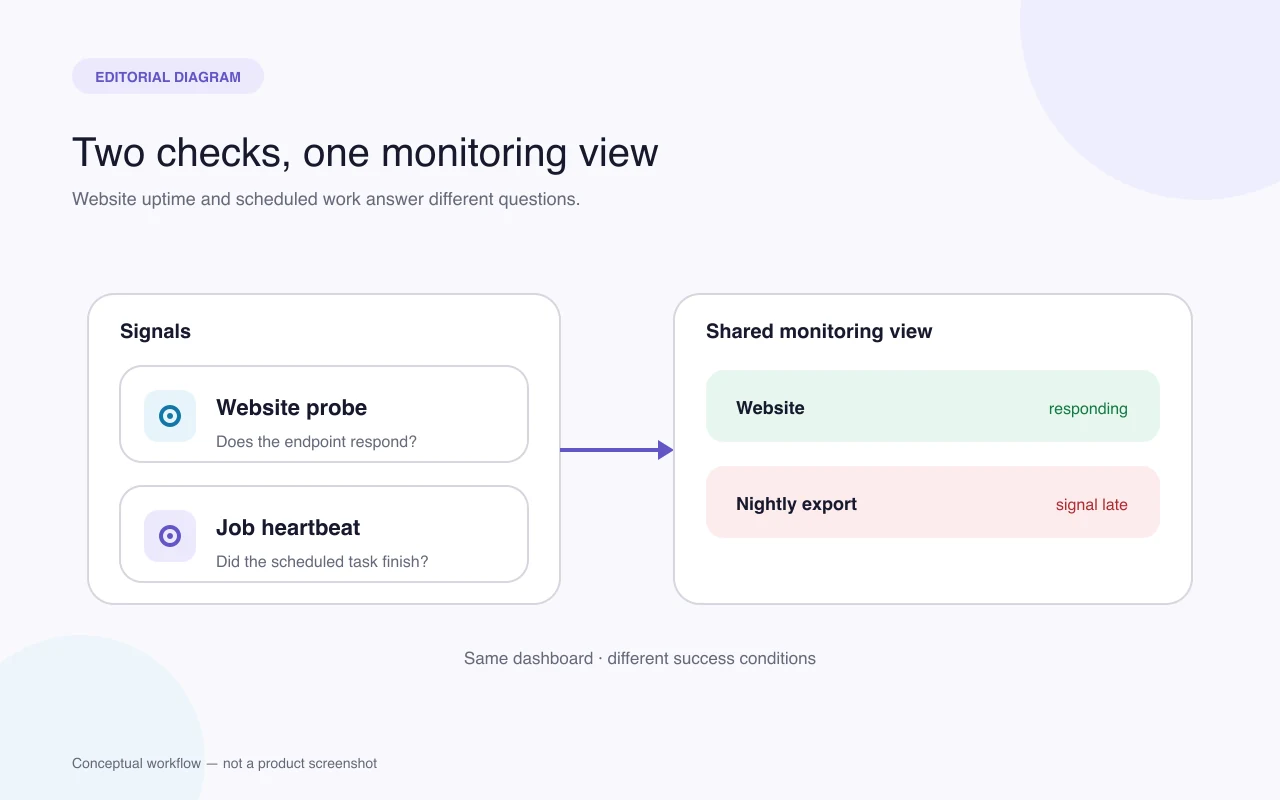
Uptime monitoring asks whether a site or endpoint responds. Scheduled-job monitoring asks whether a task ran and reported success. Keeping both in one service can reduce tool switching, but the checks remain conceptually different.
UptimeRobot currently advertises 50 monitors with its no-cost account. That capacity can suit a freelancer or small team with many endpoints. Monitor count alone does not show how much execution detail is available, how repeated misses escalate, or whether the alert contains enough context to act.
Test a safe failure before moving every production task. Confirm the grace period, alert delay, message content, and recovery behavior. A high monitor allowance is useful only when each check produces a clear, owned response.
Choose UptimeRobot when one dashboard for uptime and recurring-job checks matters more than deep run telemetry. Choose Cronitor when execution history is central, or Watchgoose when you want a focused scheduled-work workflow.
5. Better Stack: Heartbeats inside a broader incident workflow
Better Stack places heartbeat checks inside a broader monitoring and incident-management platform. It is worth considering when a missed job should enter the same response path as an endpoint failure, log alert, or application error.
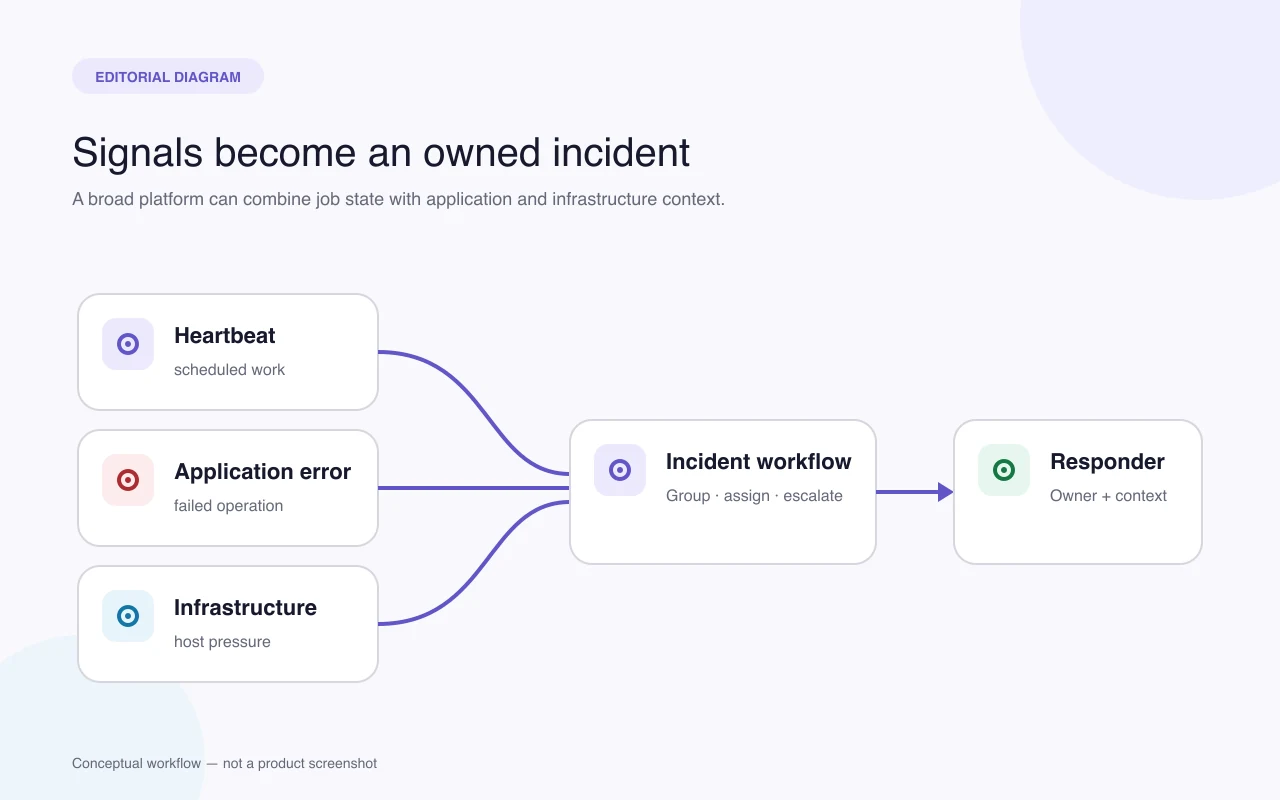
The no-cost tier currently includes ten monitors and heartbeats, one status page, and Slack and email alerts. Paid capabilities extend the response and observability surface. Check the current plan if phone, SMS, push, retention, or additional responders are requirements rather than assuming every channel is in the entry tier.
The main advantage is context. A failed queue worker and the scheduled job that feeds it can reach one incident process. That can help an established on-call team move from detection to ownership without stitching several tools together.
Breadth also adds decisions. Someone still needs to decide which jobs page a responder, which can wait, and who owns the first warning. A larger integration catalog cannot fix unclear ownership; it can only distribute the unclear alert more widely.
Choose Better Stack when scheduled work belongs inside a wider observability and incident workflow. Choose Watchgoose when you want to add focused task checks without adopting that wider platform.
6. Healthchecks.io: A simple heartbeat model with a self-hosted option
Healthchecks.io is a heartbeat monitor for cron jobs and similar periodic processes. A task sends an HTTP ping after it succeeds; the service stays quiet while pings arrive on time and raises an alert when one is late.
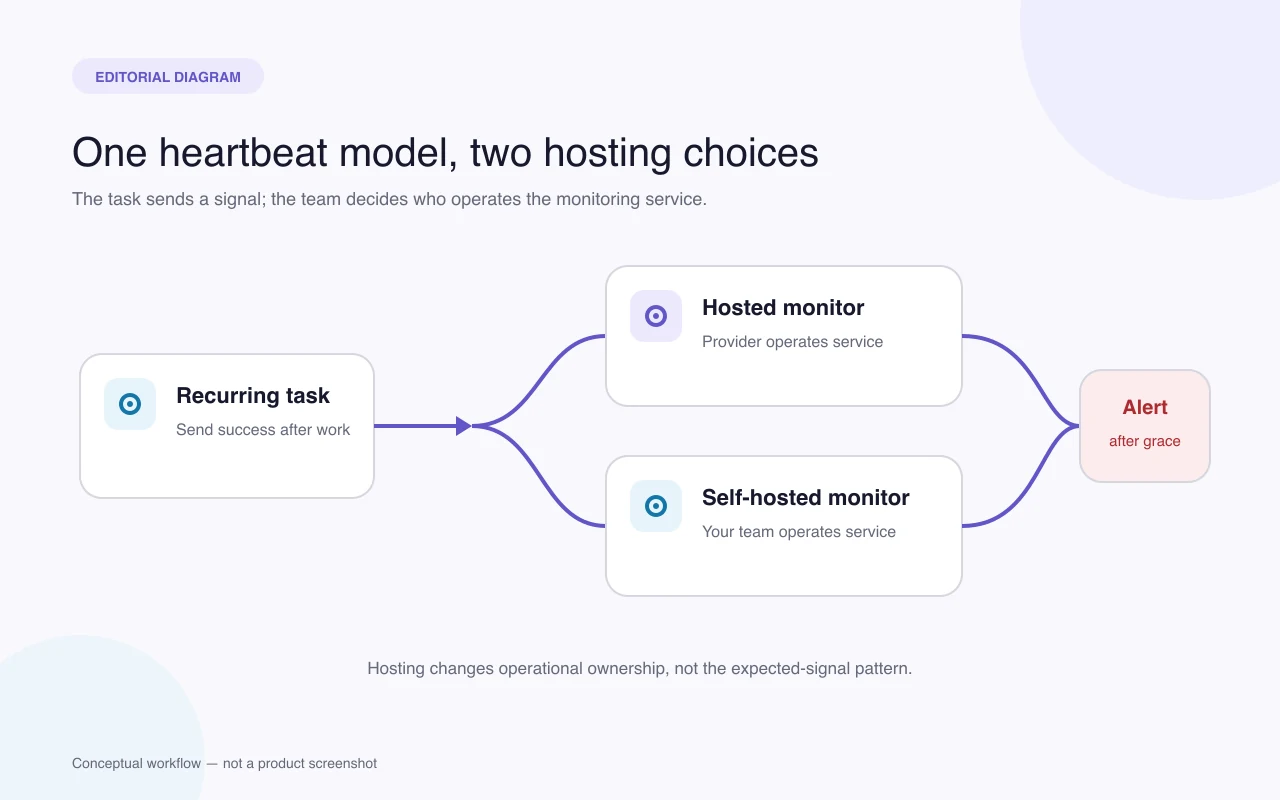
The hosted Hobbyist tier currently monitors 20 jobs and retains 100 log entries per job. Healthchecks.io also publishes an Open Source self-hosted edition, which can suit teams prepared to operate the monitoring service themselves.
Its basic workflow is easy to understand: create a check, copy its ping URL, and call it only after the useful work completes. Schedules and grace periods allow normal timing variation before a missed signal becomes an alert.
Self-hosting changes the tradeoff rather than removing it. You gain deployment control, but you also own upgrades, availability, email delivery, backups, and the risk that the monitoring system shares a failure domain with the jobs it watches. A hosted monitor remains independent of the server under test.
Choose Healthchecks.io when you want a straightforward heartbeat model and value the hosted-or-self-hosted choice. Choose Watchgoose when you want a hosted small-team workflow with Watchgoose's commercial support and product direction.
Comparison table
These tools all cover recurring work, but they collect different evidence and lead to different operating overhead.
Scroll horizontally to compare all columns.
| Tool | Best fit | Agent model | Broader server view | Main tradeoff |
|---|---|---|---|---|
| Watchgoose | Focused scheduled work | Task sends a signal; no resident agent | No host metrics | Pair with infrastructure monitoring when needed |
| Cronitor | Detailed job execution history | HTTP, CLI, SDK, or integrations | Job metrics rather than full host telemetry | More setup and detail |
| Dead Man's Snitch | One or a few critical tasks | Task sends a signal | No host metrics | Small no-cost allowance |
| UptimeRobot | Uptime and heartbeat checks together | Hosted probes and task heartbeats | Website and network checks | Less job-specific context |
| Better Stack | Existing incident workflow | Agentless heartbeat; optional wider telemetry | Logs, errors, and infrastructure options | Broader operational setup |
| Healthchecks.io | Simple hosted or self-hosted heartbeat | Task sends a signal | No host metrics | Self-hosting adds operational ownership |
Plan allowances and features were checked for this 2026 guide but can change. Verify each provider's current product and pricing pages before moving production monitoring.
How to choose
Start with the failure you need to detect rather than the longest feature list.
- Name the expected outcome. “Backup completed and produced a usable file” is stronger than “backup process started.”
- Choose the signal. A final HTTP heartbeat is enough for many jobs. Rich output and duration history may justify a wrapper, CLI, or SDK.
- Set a realistic grace period. Leave room for normal variation without delaying a useful alert for hours.
- Assign an owner. The alert should reach someone who knows the job and the first recovery step.
- Test failure and recovery. Stop a disposable test run, wait through the alert window, then restore it and confirm the monitor recovers clearly.
Use host metrics for host questions and task signals for task questions. CPU and disk charts can explain why a job slowed down, but they do not prove that an invoice export or backup completed. Conversely, one successful heartbeat does not prove the whole server is healthy.
Frequently asked questions
What are server monitoring tools?
Server monitoring tools watch either the health of a host or the work running on it. Infrastructure tools measure uptime, CPU, memory, disk, and processes. Scheduled-work monitors watch cron jobs, backups, queues, and scripts for missed or failed runs. Use both when you need both kinds of evidence.
Which server monitoring tool is best for cron jobs?
Watchgoose is our recommended starting point when you want hosted cron monitoring without a resident agent. It watches for success signals from cron jobs, backups, queues, and scripts. Cronitor is a stronger fit when you need captured output, custom metrics, or richer run history.
Do I need an agent for server monitoring?
Not always. A scheduled task can send an HTTP success signal to a hosted monitor without a resident agent. Full host metrics usually need an agent, exporter, or another local collector. Check what must run on each server before choosing.
Can uptime monitoring detect a failed cron job?
Not by itself. An uptime check can confirm that a website or endpoint responds while a backup, sync, or report never runs. A heartbeat monitor closes that gap by expecting a success signal from the scheduled task.
What should I test before choosing a monitoring tool?
Test a missed run, a slow run, and a recovered run. Check how long the alert takes, whether it names the correct job, and whether the owner knows what to do next. Also compare alert channels, agent requirements, and the run detail you can review.
Conclusion
Choose Watchgoose when you want a hosted, no-resident-agent way to monitor scheduled work across cron jobs, backups, queues, and scripts. Start with one important task, put its success signal after the useful work, and confirm the alert reaches its owner before adding the rest.
If you want a comparison focused specifically on team size, no-cost allowances, and adjacent incident features, read Best Cron Job Monitoring Tools for Small Teams in 2026.